Chessbrief
Reads every game you have ever played on Chess.com and tells you the true things in order of how well the evidence supports them.
Try it: chessbrief.bmux.sh
What it is
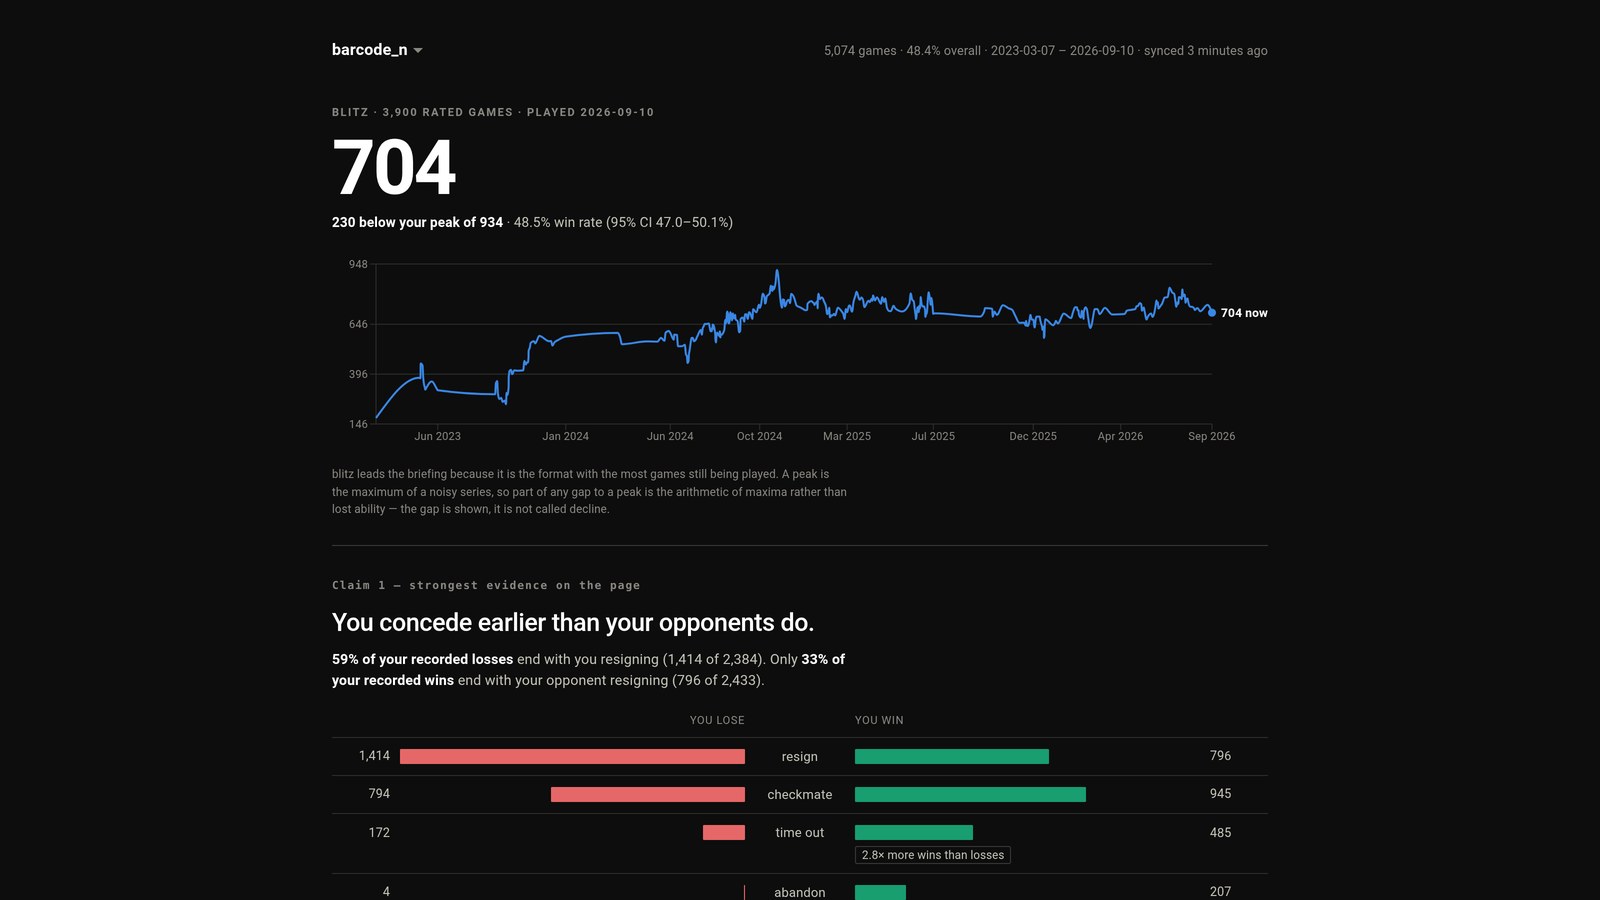
Point it at a Chess.com account and it pulls the whole archive — five thousand games across three and a half years, in the case above — and writes a briefing. Not a dashboard. A briefing: a ranked list of claims about how you play, each one with the numbers that support it sitting directly underneath.
The top of the page picks a format and says why it picked it: blitz leads the briefing because it is the format with the most games still being played. That sentence is the whole design in miniature. Every choice the page makes about what to show you, it shows you.
The thing worth stealing
Analytics tools almost always overclaim, because a confident sentence is more satisfying than an honest one. This one is built to refuse.
Three habits do it:
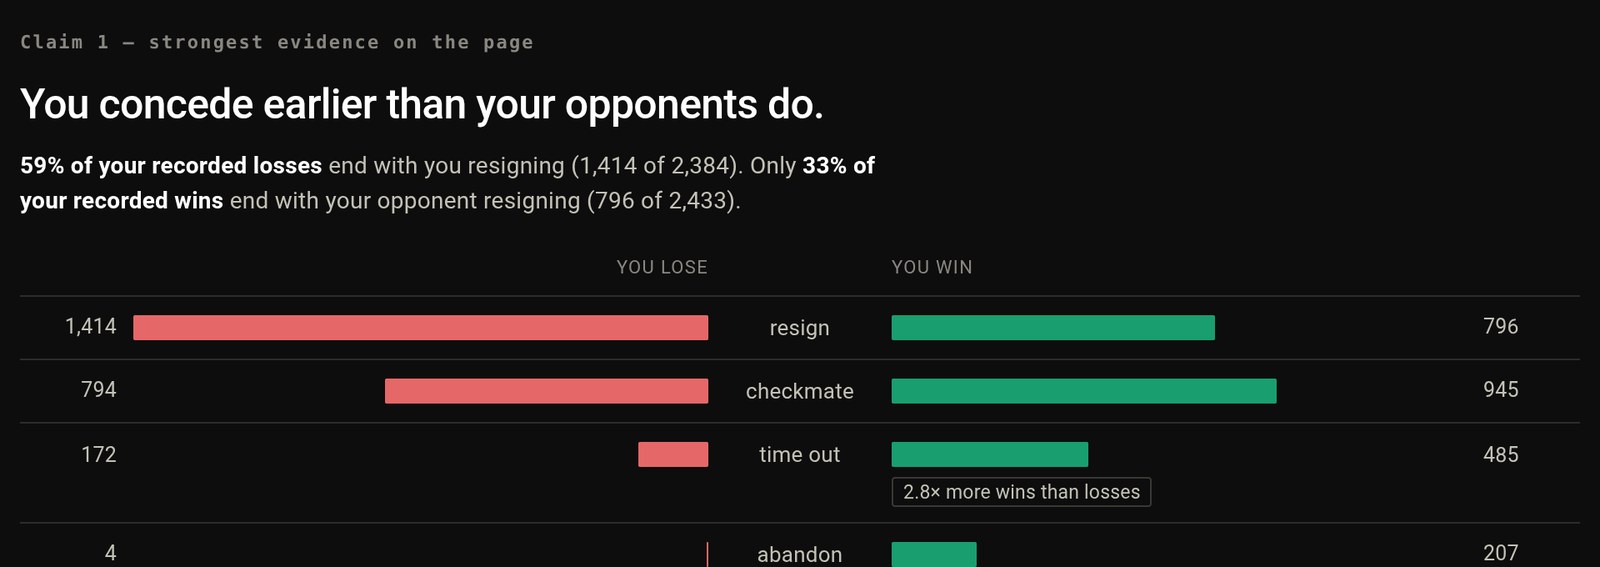
Claims are ranked by evidence, not by drama. The heading above the first one literally reads strongest evidence on the page. The interesting-sounding finding does not get to go first just because it is interesting.
Intervals, not points. A win rate arrives as 48.5% with a 95% interval of 47.0–50.1%, so the reader can see when a difference is too small to mean anything.
It argues against its own framing. The page notes that a peak is the maximum of a noisy series — so part of any gap between where you are and your best number is just the arithmetic of maxima rather than ability you have lost. Then it does the thing almost nothing does: shows the gap, and declines to call it decline.
That last one is a tool deliberately giving up its most emotionally effective sentence because the sentence would not be true. Every rating graph ever drawn invites “you’re getting worse.” This one puts up the number and refuses the story.
What it actually finds
The claims are concrete and slightly uncomfortable, which is the point. The example above: 59% of recorded losses end in resignation, against only 33% of wins ending with the opponent resigning. Stated plainly — you concede earlier than your opponents do — and backed with the full breakdown of how games end, wins against losses, including the lopsided ones. Timeouts run 2.8× more wins than losses; abandons are 4 against 207.
None of that is a tip. It is a description, with the arithmetic attached, and it leaves the conclusion to you.
Technical details
| Frontend | Next.js, React |
| Data | Chess.com public API — full game archive, synced on load |
| Scale | ~5,000 games, 3.5 years, per-format breakdowns |
| Statistics | 95% confidence intervals; explicit noise caveats on peaks |
| Structure | Ranked claims, each with its own evidence block |